 ATL
 NO
 DAL
 CAR
 DET
 MIA
 LA
 WAS
 NYG
 NYJ
 KC
 LAC
 LV
 SF
 ARI
 SEA
 GB
 TB
 CHI
 BUF
 MIN


This looks like a close contest, but we give a slight edge to JAX. JAX have been hot lately, winning 4 of their last 5.
Quarterback watch: BAL starting QB Tyler Huntley is Doubtful
Matchups to watch
How each player gets his production, set against how this opponent has defended it over their last 17 games. After the game we grade who won each one.
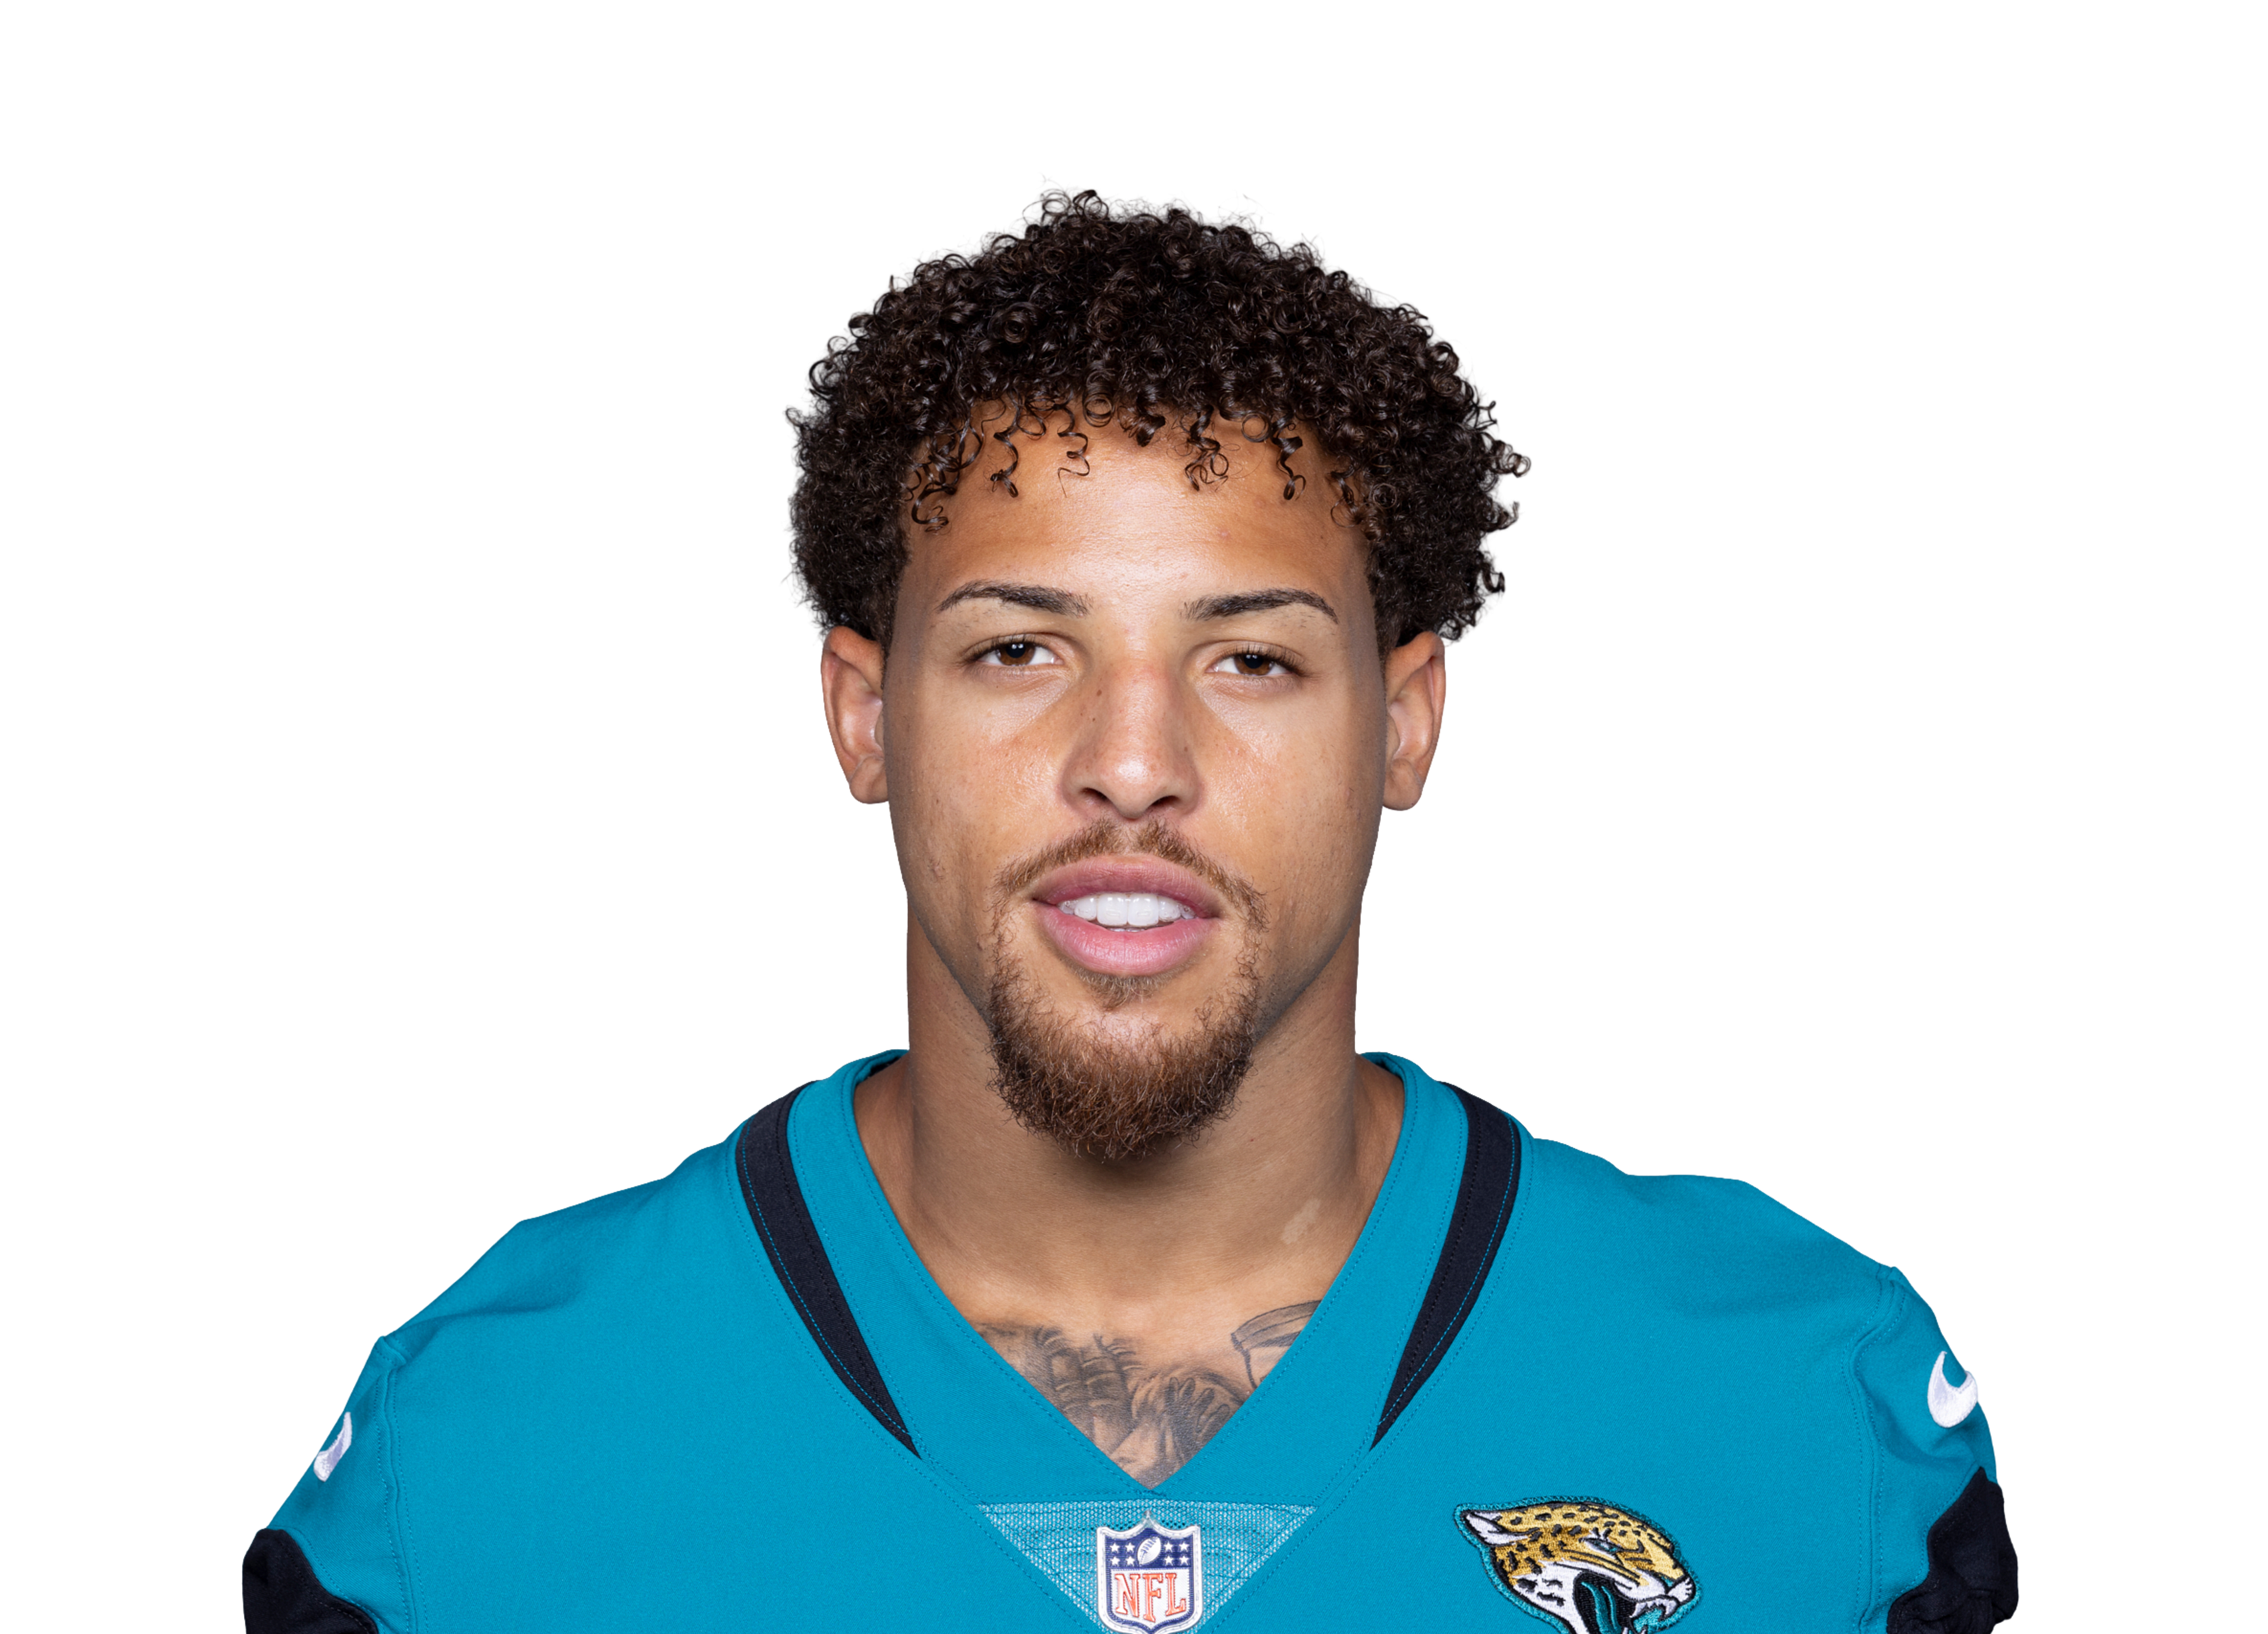
Where his targets come from
Share of his targets. The white tick is the league average.
How BAL defend it
Ranked of 32, last 17 games. Green is a weakness to attack.
- Baltimore rank 30th against deep balls, and 25% of Washington's targets travel 20+ yards (the average WR is at 17%).
- Work the left side: 51% of his targets go that way and Baltimore rank 22nd defending throws there.
- Contested catches aren't his edge this week: he's 9th percentile for separation and 18th for hands, and Nate Wiggins and Chidobe Awuzie both allow fewer yards per target than the average corner (7.4).
- Free data doesn't show who covers whom on each snap, so this is the defence's profile, not a confirmed one-on-one.
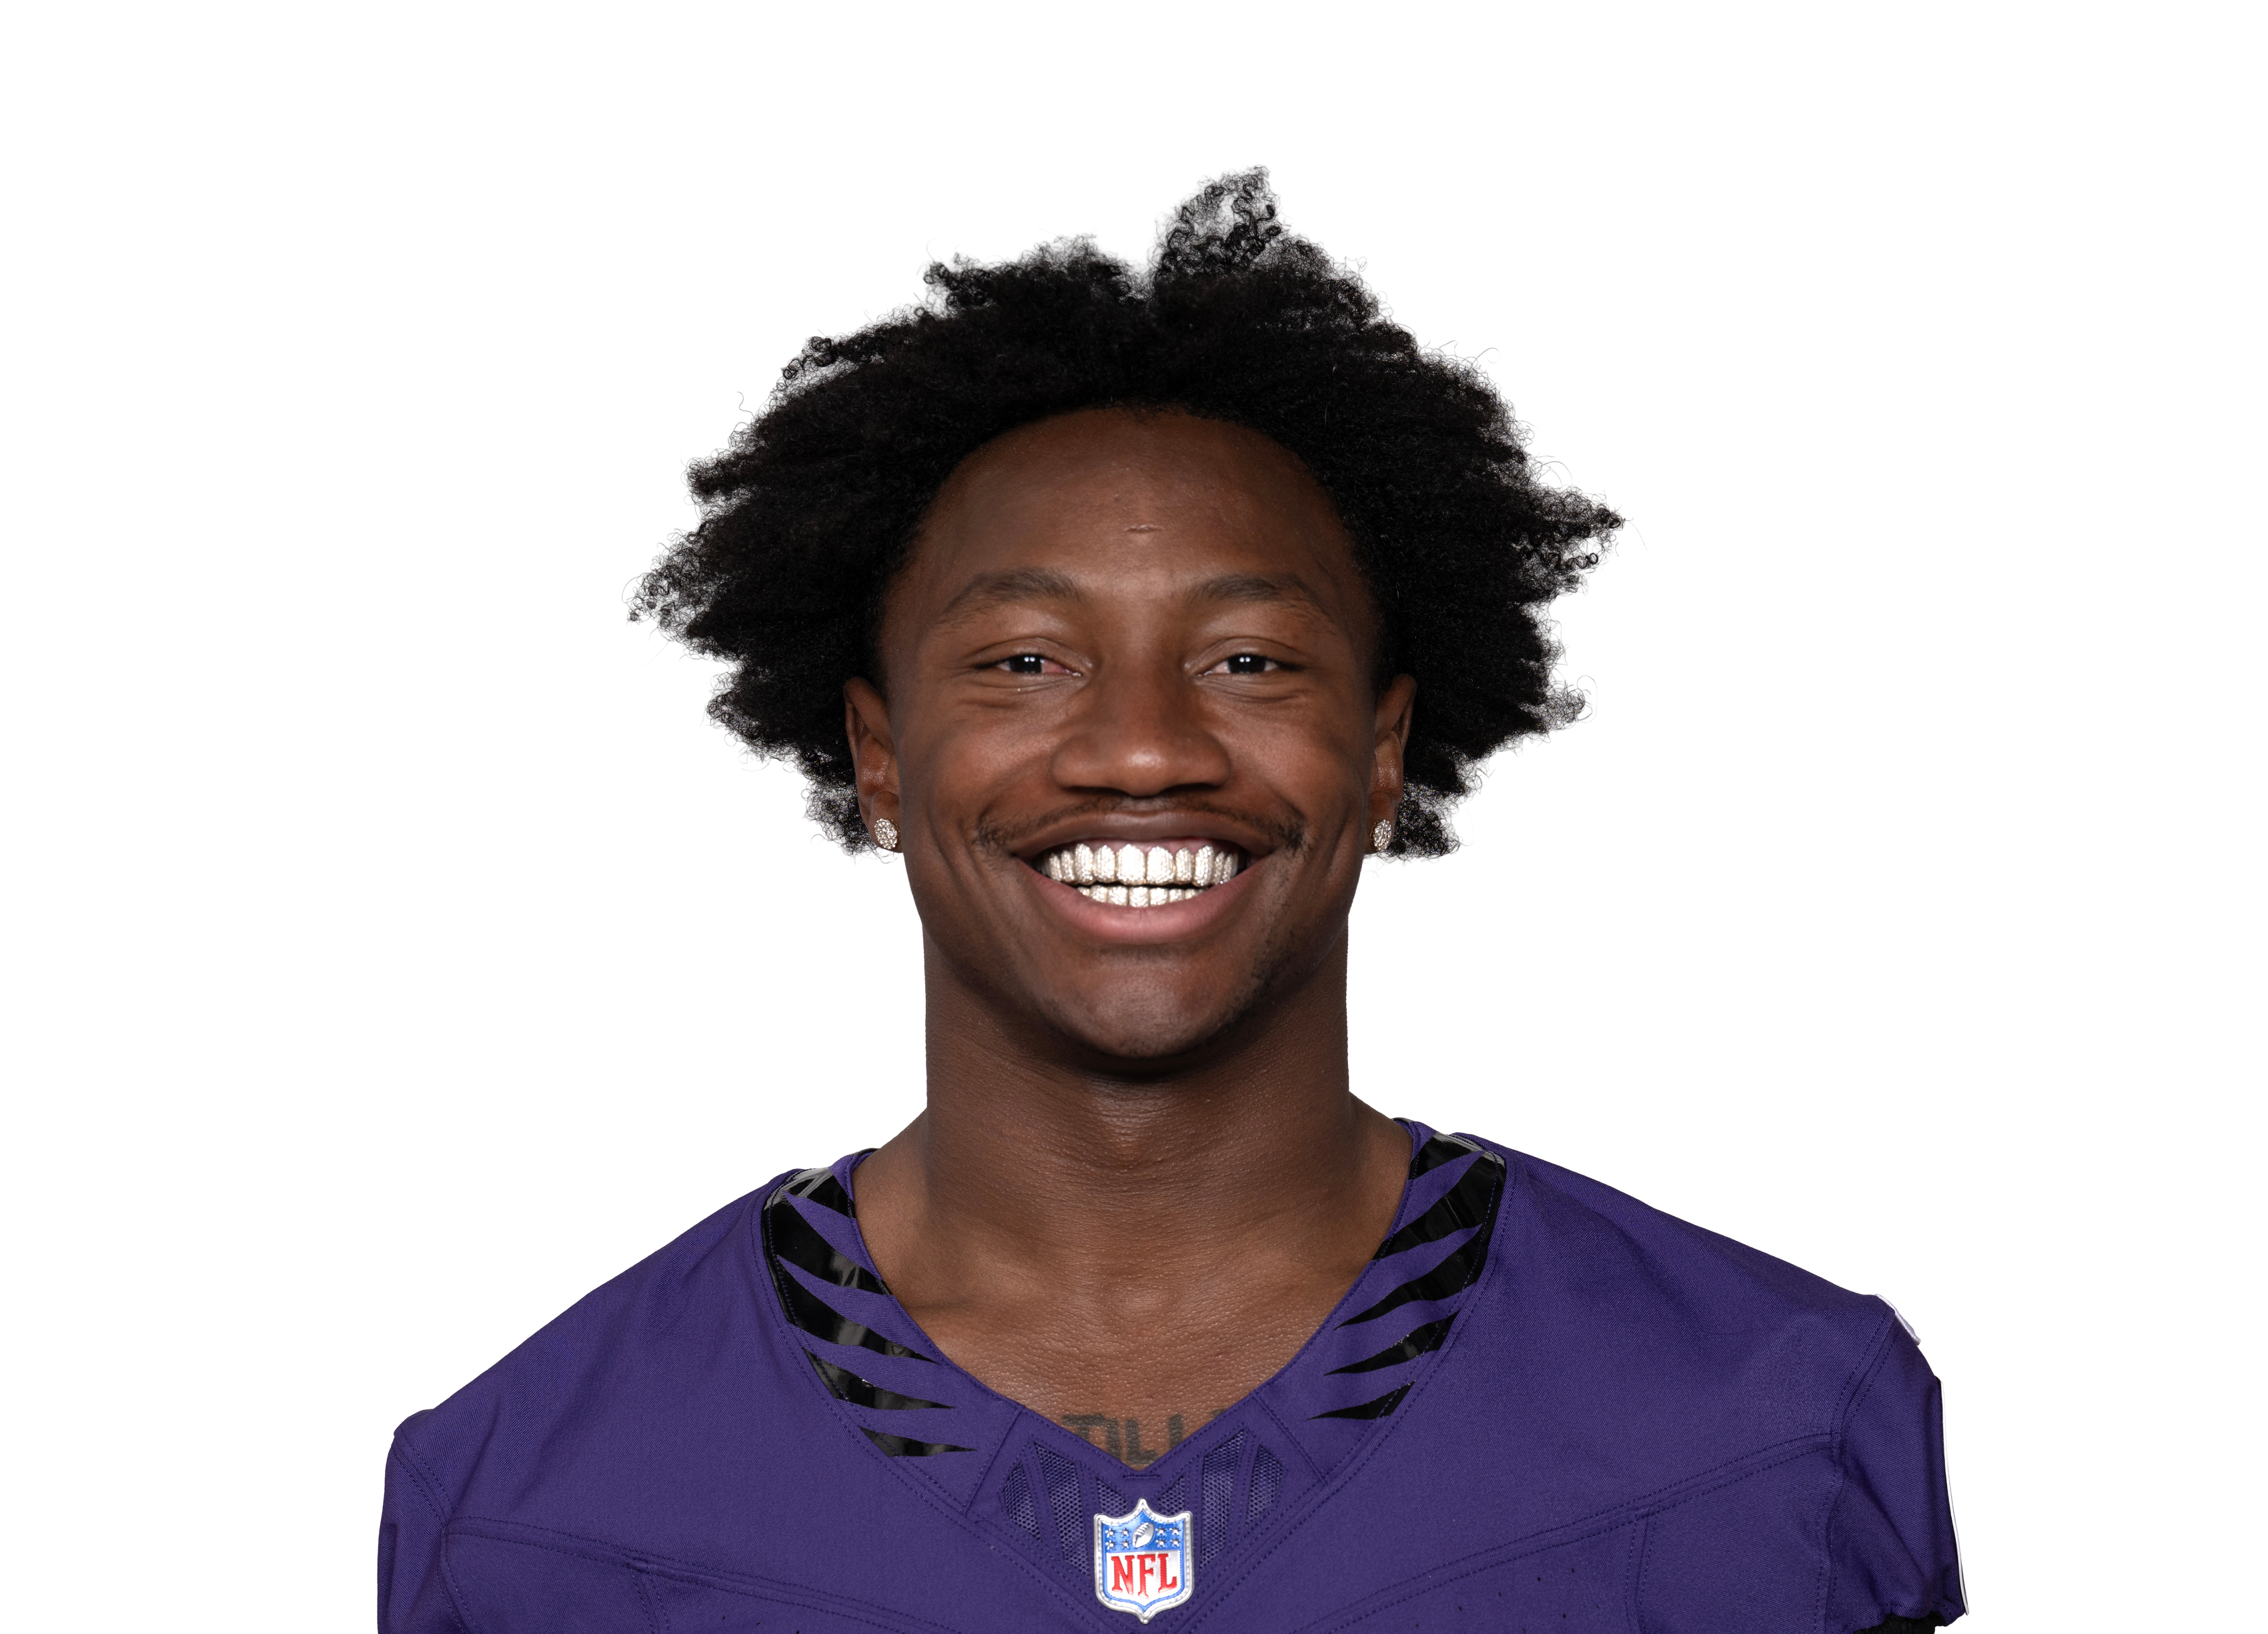
Where his targets come from
Share of his targets. The white tick is the league average.
How JAX defend it
Ranked of 32, last 17 games. Green is a weakness to attack.
- Jacksonville are mid-table or better at every depth over their last 17 games. Flowers's likeliest route is deep balls (16% of his targets), where they rank 14th.
- Contested catches aren't his edge this week: he's 84th percentile for separation and 18th for hands, and Jarrian Jones, Greg Newsome II and Jourdan Lewis all allow fewer yards per target than the average corner (7.4).
- Free data doesn't show who covers whom on each snap, so this is the defence's profile, not a confirmed one-on-one.
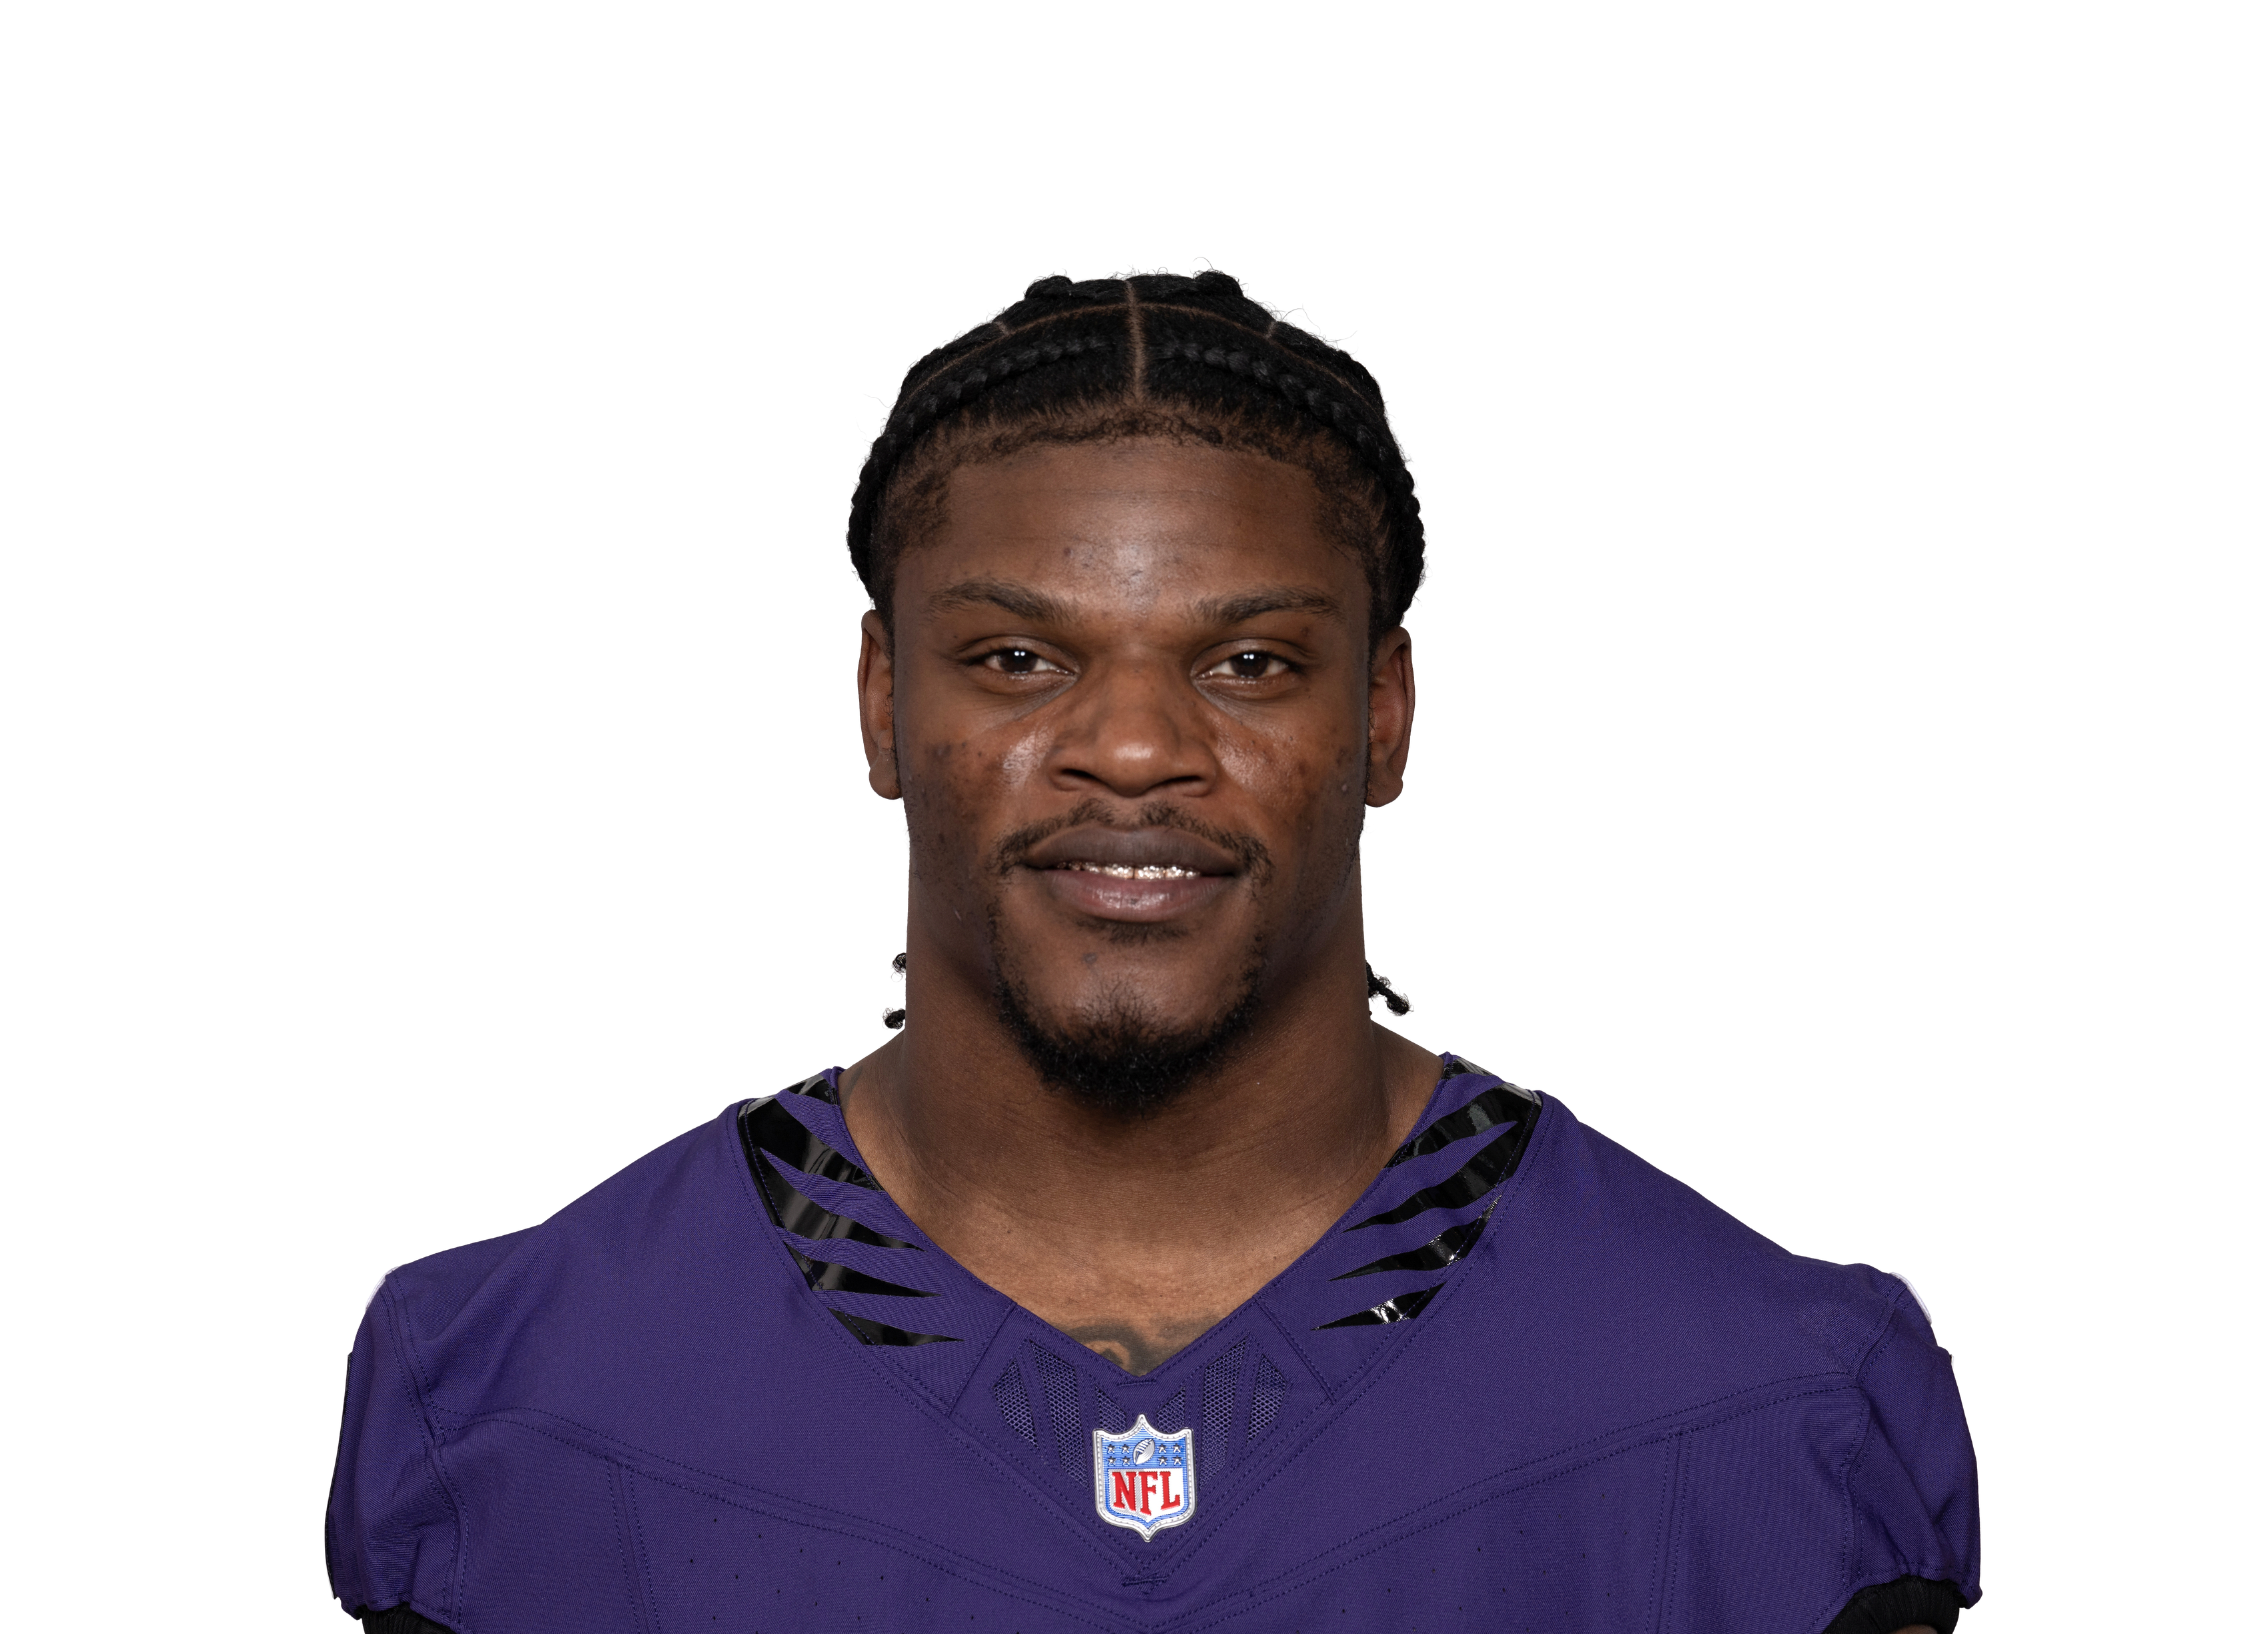
How JAX defend it
Ranked of 32, last 17 games. Green is a weakness to attack.
- Jacksonville rank 3rd in EPA per dropback allowed over their last 17 games. Their weakest area is deep balls (14th).
- Pressure: Jacksonville are 24th at getting sacks, and Baltimore are 26th at avoiding them.
Unit by unit
Each unit ranked against all 32 teams on 2026 play-by-play through week 8. Longer bar is better; a gold rank marks the side with the edge.
When the Jaguars have the balloffence against defence, rank of 32 (1st is best)JAX offenceBAL defenceBiggest gap: rushing, where the Jaguars offence has a 20-place edge.
When the Ravens have the balloffence against defence, rank of 32 (1st is best)BAL offenceJAX defenceBiggest gap: rushing, where the Jaguars defence has a 15-place edge.
Form and history
Jaguars this season 34-10wk 1 vs CLEL
 13-20wk 2 at DENW
 35-6wk 3 vs NEW
 22-17wk 4 at CINW
 19-17wk 5 vs PHIL
 31-34wk 6 vs HOUW
 42-7wk 8 vs INDRavens this season
 23-7BAL at JAX
2023-12
27-28BAL at JAX2022-11
Injury report
Jaguarsmodel impact 0.0| Zach DurfeeDE · Upper Body | IR |
| B.J. Green IIDE · Elbow | IR |
| Parker HughesLB | IR |
| Jared BartlettLB · Leg | IR |
| DaVon HamiltonDT · Knee | IR |
| Patrick MekariOL · Back | IR |
| Anton HarrisonOL · Knee | IR |
| Sam MustipherOL | IR |
| Eric MurrayDB · Elbow | IR |
| Caleb RansawDB · Knee | IR |
| Garrett DiGiorgioG | IR |
| Jakobi MeyersWR · Hamstring | Questionable |
Ravensmodel impact -2.9| Lamar JacksonQB · Thumb | Out |
| Skylar ThompsonQB | IR |
| Adam RandallRB | IR |
| Durham SmytheTE · Achilles | IR |
| Bilhal KoneCB · Lower Body | IR |
| Tavius RobinsonDE · Pectoral | IR |
| Jovaughn GwynOL · Lower Leg | IR |
| Ethan PocicOL · Knee | IR |
| Danny PinterG · Knee | IR |
| Jahquez RobinsonDB | IR |
| Tyler LoopK · Groin | IR |
| Tyler HuntleyQB · Toe | Doubtful |
Player props
Every posted line with the market's view and each player's last ten games against it.
| Player | Market | Line | Price | Market over | Last 10 games | Hit rate |
|---|---|---|---|---|---|---|
| Joe FagnanoBAL | Passing yards | 155.5 | 1.89 | 50% | 60% | |
| Trevor LawrenceJAX | Passing yards | 235.5 | 1.89 | 50% | 20% | |
| Joe FagnanoBAL | Passing TDs | 0.5 | 1.78 | 53% | 60% | |
| Trevor LawrenceJAXrole up | Passing TDs | 1.5 | 1.64 | 58% | 40% | |
| Derrick HenryBAL | Rushing yards | 68.5 | 1.88 | 50% | 70% | |
| Justice HillBALrole up | Rushing yards | 13.5 | 1.90 | 50% | 40% | |
| Trevor LawrenceJAXrole up | Rushing yards | 11.5 | 1.89 | 50% | 30% | |
| Brenton StrangeJAX | Receiving yards | 35.5 | 1.88 | 50% | 30% | |
| Brian Thomas JrJAX | Receiving yards | 12.5 | 1.92 | 49% | 60% | |
| Derrick HenryBAL | Receiving yards | 7.5 | 1.84 | 51% | 40% | |
| Ja'Kobi LaneBAL | Receiving yards | 16.5 | 1.89 | 50% | 50% | |
| Jakobi MeyersJAXrole up | Receiving yards | 39.5 | 1.87 | 51% | 90% | |
| Josh CameronJAX | Receiving yards | 10.5 | 1.86 | 51% | 30% | |
| Josh CuevasBAL | Receiving yards | 7.5 | 1.88 | 50% | 30% | |
| Justice HillBALrole up | Receiving yards | 15.5 | 1.93 | 49% | 30% | |
| Mark AndrewsBALrole up | Receiving yards | 19.5 | 1.88 | 50% | 100% | |
| Nate BoerkircherJAX | Receiving yards | 7.5 | 1.90 | 50% | 60% | |
| Parker WashingtonJAXrole up | Receiving yards | 64.5 | 1.88 | 50% | 10% | |
| Rashod BatemanBAL | Receiving yards | 14.5 | 1.90 | 50% | 80% | |
| Travis HunterJAX | Receiving yards | 9.5 | 1.93 | 49% | 90% | |
| Zay FlowersBAL | Receiving yards | 46.5 | 1.89 | 50% | 60% | |
| Brenton StrangeJAXrole up | Receptions | 3.5 | 1.79 | 53% | 30% | |
| Brian Thomas JrJAX | Receptions | 1.5 | 2.57 | 37% | 70% | |
| Derrick HenryBALrole up | Receptions | 1.5 | 2.13 | 44% | 40% | |
| Ja'Kobi LaneBAL | Receptions | 1.5 | 1.93 | 49% | 50% | |
| Jakobi MeyersJAX | Receptions | 3.5 | 2.19 | 43% | 90% | |
| Josh CameronJAX | Receptions | 1.5 | 2.35 | 40% | 30% | |
| Josh CuevasBAL | Receptions | 1.5 | 2.59 | 37% | 30% | |
| Justice HillBAL | Receptions | 2.5 | 2.00 | 47% | 50% | |
| Mark AndrewsBALrole up | Receptions | 2.5 | 1.83 | 51% | 60% | |
| Nate BoerkircherJAX | Receptions | 0.5 | 1.48 | 64% | 100% | |
| Parker WashingtonJAXrole up | Receptions | 4.5 | 2.04 | 46% | 20% | |
| Rashod BatemanBALrole up | Receptions | 1.5 | 1.97 | 48% | 80% | |
| Travis HunterJAX | Receptions | 0.5 | 1.43 | 66% | 90% | |
| Zay FlowersBALrole up | Receptions | 4.5 | 2.15 | 44% | 50% |
"Market over" is the bookmaker's price with the margin taken out. Green bars are games that cleared the line. Our own prop model is switched off until it passes a public audit on 2026 data, so we show the market and the history, not a tip.
The betting view
Posted odds, the same odds with the bookmaker's margin removed, and where the model disagrees.
Read this before you bet: picking winners is not beating the price. At posted odds our 2025 flat-bet ROI was −6.9%. Use the model as one view of the game, not a tip.
What the model sees
Model favors JAX (74%) by 6.2 points.